

Turn Down for What: Feedback Fiascos and How to Fix Them
Live events are a breeding ground for the dreaded beast known as audio feedback, a nightmare that'll make your ears wish they'd never been born. This guide pretends to be your knight in shining armor, offering a bunch of theoretical fixes with RTAs and EQs, because, sure, technology always works perfectly in the chaos of live sound. It's certainly better than nothing!
SETLIFETIPS
Kevon Marshall
3/21/20246 min read
Using an RTA I myself downloaded from the App Store has been essential to the success of the live events I’ve operated. There are also software versions of RTA’s that are operated with a computer, such as Rational Acoustics Smaart RTA.
These types tend to cost more money and are used in conjunction with an external microphone, audio interface, and whatever items are needed for the sound to be captured by the computer so the information can be displayed in the RTA software. On the other hand, when using a mobile device, the internal microphone is used to capture the sound information of your environment to be analyzed & displayed on your phone screen, making it as easy as pulling your phone out and use the RTA app as opposed to setting up a microphone, mixer, & laptop workstation.
So with that brief introduction to RTAs, you are probably asking yourself, “How do we reduce feedback with a real time analyzer?” Well, the answer is by identifying what audio frequencies are causing the feedback and then lowering the individual frequency or range of frequencies that are feeding back. If you don’t know, sound is vibrational waves measured in hertz (Hz) emitted through the air that is picked up by our eardrums, then processed by our brain, and we perceive it as the daily ambiance, conversations, and sounds we hear. The average human ear can detect sound frequencies ranging from 20Hz to 20kHz, therefore the interface of a RTA displays the sound frequencies using a real-time bar or line graph, ranging from 20Hz to 20kHz,along with the correlating audio level. The horizontal line of the graph will represent the frequencies, while the vertical line represents the frequency’s dB level—measurement of sound pressure level; loudness.
When setting up & operating live events, you will encounter audio issues that you typically wouldn’t in a controlled recording environment or in a recording studio. One major issue in live sound is audio feedback. Audio feedback occurs when a microphone picks up the input signal coming from the output speaker, causing it to continuously amplify itself as it loops through the microphone & output speakers. Not only is audio feedback a nightmare for the audio engineer, it’s also a nuisance to the talent, keynote speakers, and audience in attendance. The feedback typically occurs when a speaker, emcee or presenter holding a microphone, or is mic'd up, walks in front of a speaker or gets into close proximity of the speaker's throw direction—the direction the speaker is pointed.
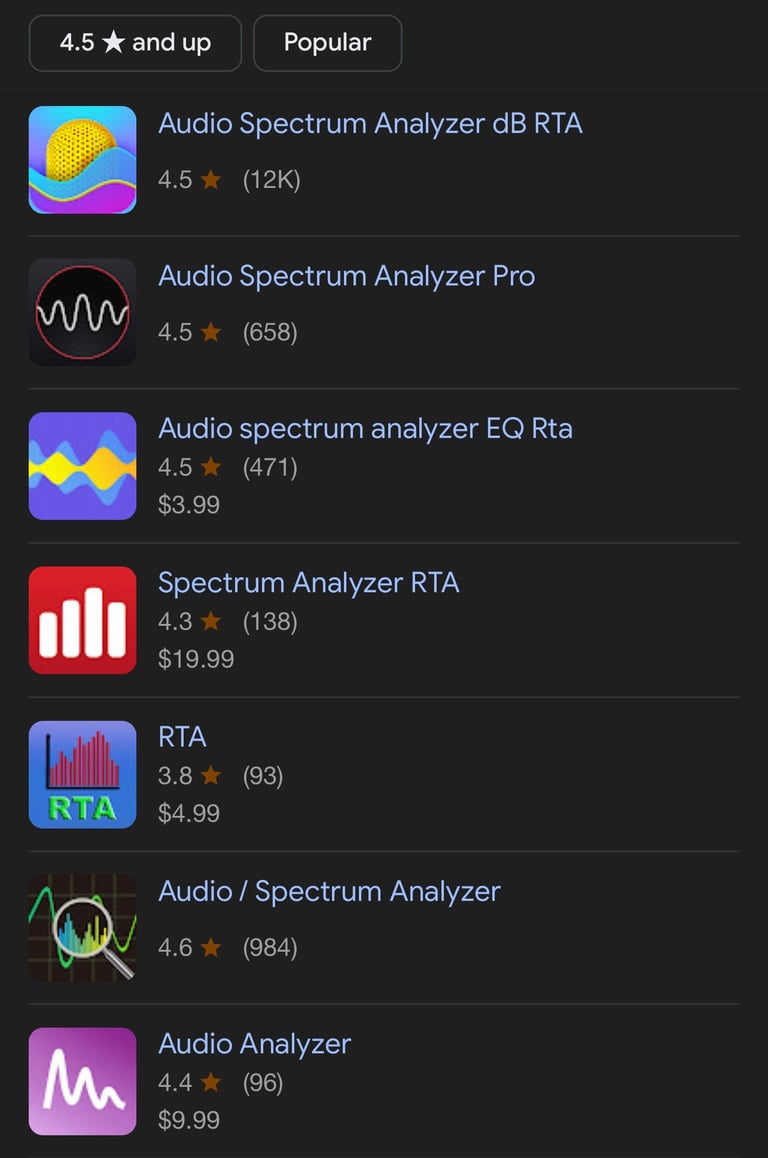
The way to eliminate the feedback is to get it in-check during the setup phase for your live event. That’s when having a tool like a real-time analyzer, or RTA for short, becomes your best friend. RTA’s can be purchased or even free using your mobile device's App Store or Play Store.
After identifying the frequencies that are feeding back, you would take that information and use your audio engineering skills and tools to reduce or eliminate the feedback. Using a 31-band EQ is one of the most precise ways to reduce the level of a single audio frequency. You can apply it on the main LR output channels and use it to tune the entire output or “room”. Be sure to only reduce the frequencies that are feeding back and not to over-EQ the entire LR mix. By adjusting the EQ, you are also changing the characteristics of the voice and one goal is to keep the voice sounding as natural as possible. You can also try applying an EQ on the individual microphone channel and reduce the frequencies on that single channel. Most audio mixers will have a parametric EQ you can apply on each input. You may be limited to that EQ’s set frequencies or frequency ranges, but it’s better than nothing.
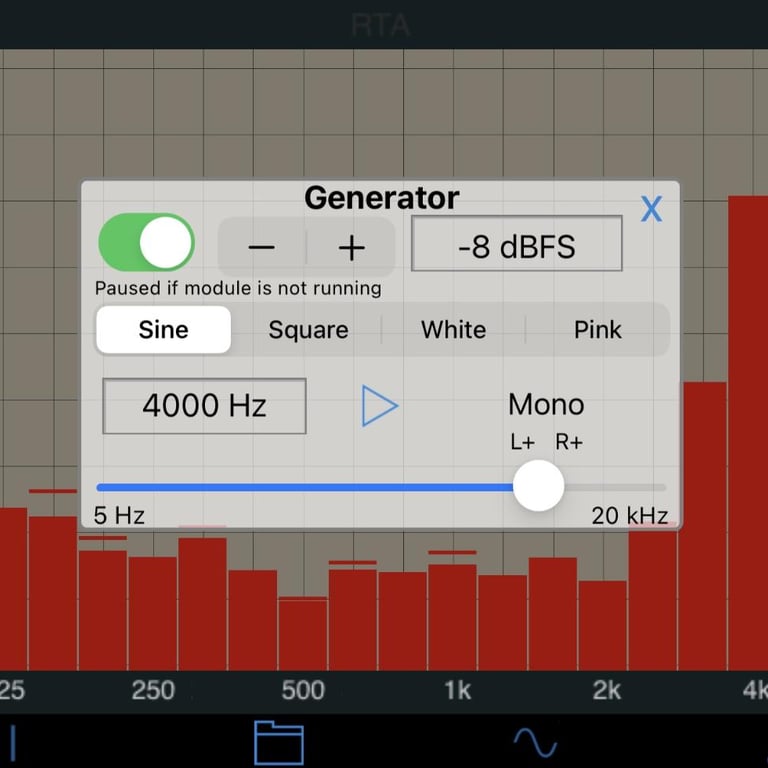
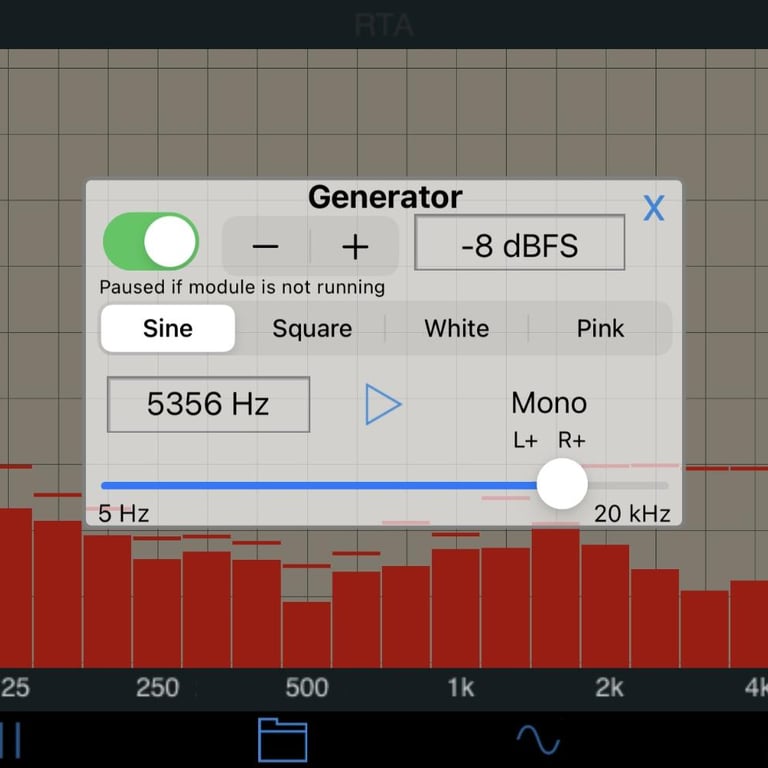
These are just a few of many ways to tune your room with the information you get from an RTA app. Some RTA apps, mostly the paid apps, come with useful tools as well, such as a tone generator or sound pressure level measurement tool. A tone generator can generate a single frequency sound wave, white noise, and even pink noise. That’s a convenient way to practice hearing and identifying sound frequencies in the palm of your hand. You could generate white or pink noise to get a screenshot of how your room reacts to it.
Some mixers use the white noise information and EQs the curve of the white noise on the graph to flatten out the room's reaction as much as possible before distorting the sound. Since white noise is an equal amount of all frequencies being emitted, then when the white noise levels are equal on every frequency on your RTA graph, then the room is truly flat!
A sound pressure level, or SPL, measurement tool can be used to get an overall dB level of your sound system. That information can be used to know the performance levels of your equipment and if they are performing up to the specs or not. It can be used to fine tune the aim and amplitude of your output speakers so they aren’t so loud that they are uncomfortable to the audience instead of appropriate for the context of the event. It can also be used to know if you are in parameters of a performance permit, and not being louder than you were permitted to be.
I highly recommend downloading a RTA app on your mobile phone if you are new to the audio field. It’s an affordable, reliable way to troubleshoot your way through many audio feedback scenarios with confidence & convenience. There are some key things to keep in mind when choosing a RTA app. Not all apps are created equal and some cost more than others. One that I’ve purchased and have had success with is the RTA app located in the Apple App Store for $4.99. It’s a simple RTA, with a user-friendly interface that’s easy to navigate and familiarize yourself with in no time at all!
Lastly, when EQing your sound system and tuning room, remember that it is mandatory to eliminate any microphone feedback before the event kicks off. Be sure to reenact scenarios where talent or presenters might be walking in front of your front of house speakers to see if they are safe enough to do so with the EQ settings you apply. Also try a few unlikely scenarios so nothing will catch you by surprise! Be sure to apply the EQ methods to monitor wedges when engineering for bands, to ensure that their vocal mics don’t cause feedback due to the close proximity of the wedge speaker to the talent. They will love and appreciate you for doing your due diligence and having their wedges in-check before they actually perform. And ultimately, be sure not to over EQ your system. Do what you need to eliminate feedback while keeping the integrity of your audio.
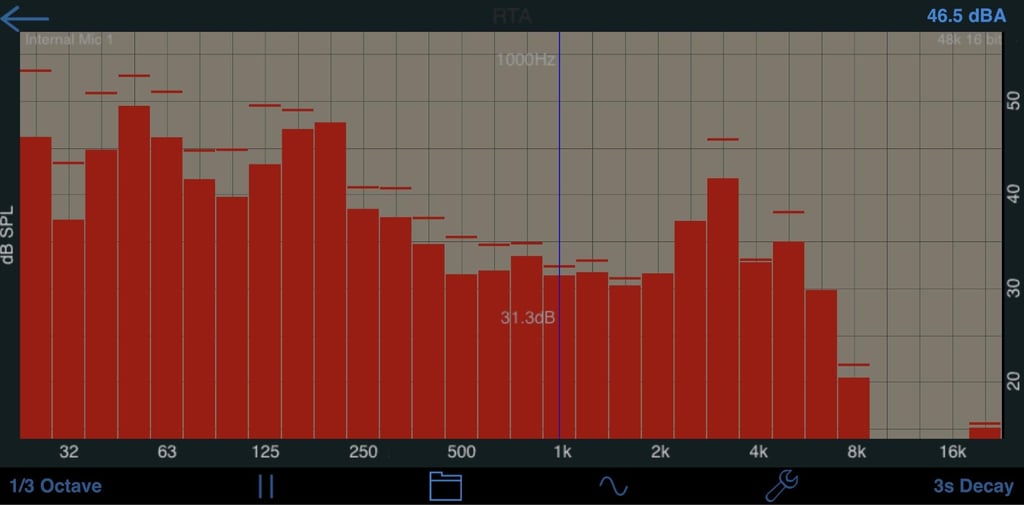
With the RTA app open, allow it to listen to the sound and atmosphere of the room you are in and you will see the bar or line representing the sound frequencies their respective dB level. After building your sound system and connecting all your input sources, grab a microphone and turn it on. Bring it into the mix and as you talk into the microphone and hear your voice coming through the sound system, look at your RTA app and you will notice the level changing as you speak. Be mindful of others in the room and let them know that you are about to do a frequency feedback check. Start approaching an output speaker. If there are no EQ settings on that microphone, you will start to get feedback the closer you get to the output speaker. Once you hear the feedback, check the RTA to identify what frequency you are hearing. Every room and venue is different and has its own acoustic characteristics, so this isn’t a global setting you can expect to work at every venue.
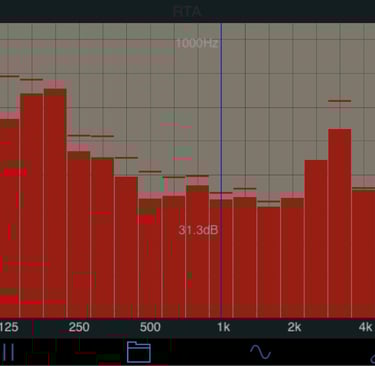
Notice in the two following photos, the frequency being generated is the highest bar on the graph. It indicates that that particular frequency is at that dB level. The more out of control and loud the frequency gets due to how close the microphone is to the speaker, the RTA will display the information in real time.
Get in touch
© 2025 Vandelay Sound Exports, Inc. • RETURN Policy • Privacy Policy • Terms and Conditions